

Causal Loop Diagrams are a simple way to show the relationships between parts of a system and their effects on each other. I find them a simple and effective method for both exploring how a system works and understanding how changes to that system are likely to affect it.
- Start with any part of the system. Write a short description. For example: number of defects, product functionality promises by sales, or developer vacations.
- Identify any other part of the system that is connected in any way to the part you just identified. Write a short description.
- Connect the two parts with a curve marked with two things: an arrow indicating the direction of the effect, and a ‘+‘ or a ‘-‘ indicating whether the affected part grows or shrinks.
- Continue adding parts of the system and connections between parts until you’ve mapped out all of the parts that seem relevant.
- Go back through your diagram and name each loop of connections you identify. If the loop continually grows or shrinks, tag it with an ‘R‘ for ‘reinforcing’. If the loop instead balances itself, tag it with a ‘B‘ for ‘balanced’.
Here’s a simple example from the Wikipedia article:

Here’s a less simple example, also from the Wikipedia article:
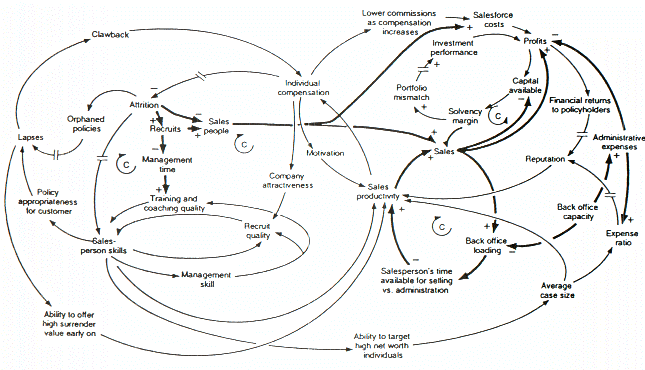
As this latter diagram shows, causal loop diagrams can rapidly become complex. This is why I recommend you include only the parts of the system that seem relevant to the problem you are attempting to model. While every part of a system has effects on every other part, very few of those parts have meaningful effects on others. Only include the parts of the system that have meaningful effects on the behavior you want to understand.
Your causal loop diagram can help you understand how the system is working today. It can also help you predict how changes to that system are likely to affect it. A bit of time modeling the system can save you a lot of trial and error.
Once you identify some changes that seem useful, perform some Tiny Experiments. If their results match what your model predicted, great! If their results are different from what you predicted, go back to your diagram and adjust it to match. Just a few of these iterations is often sufficient for your diagram to consistently model your reality. Even if you never get to that point, however, your diagram will help you understand what’s going on!
Many thanks to Jerry Weinberg for first introducing me to Causal Loop Diagrams!